Version 1.0
Created: 9 August 2024
Updated: 9 August 2024
Understanding the Metrics Dashboard
The Metrics Dashboard is used for monitoring key performance indicators and providing an overview of job statuses and service performance to assist in effective job management and decision-making.
Navigate to the section by clicking it.
-
At the desktop’s navigation bar, go to Business Metrics > Metric Dashboard.
Open Metric Dashboard Here: https://system.caction.com/dashboard/metric/overview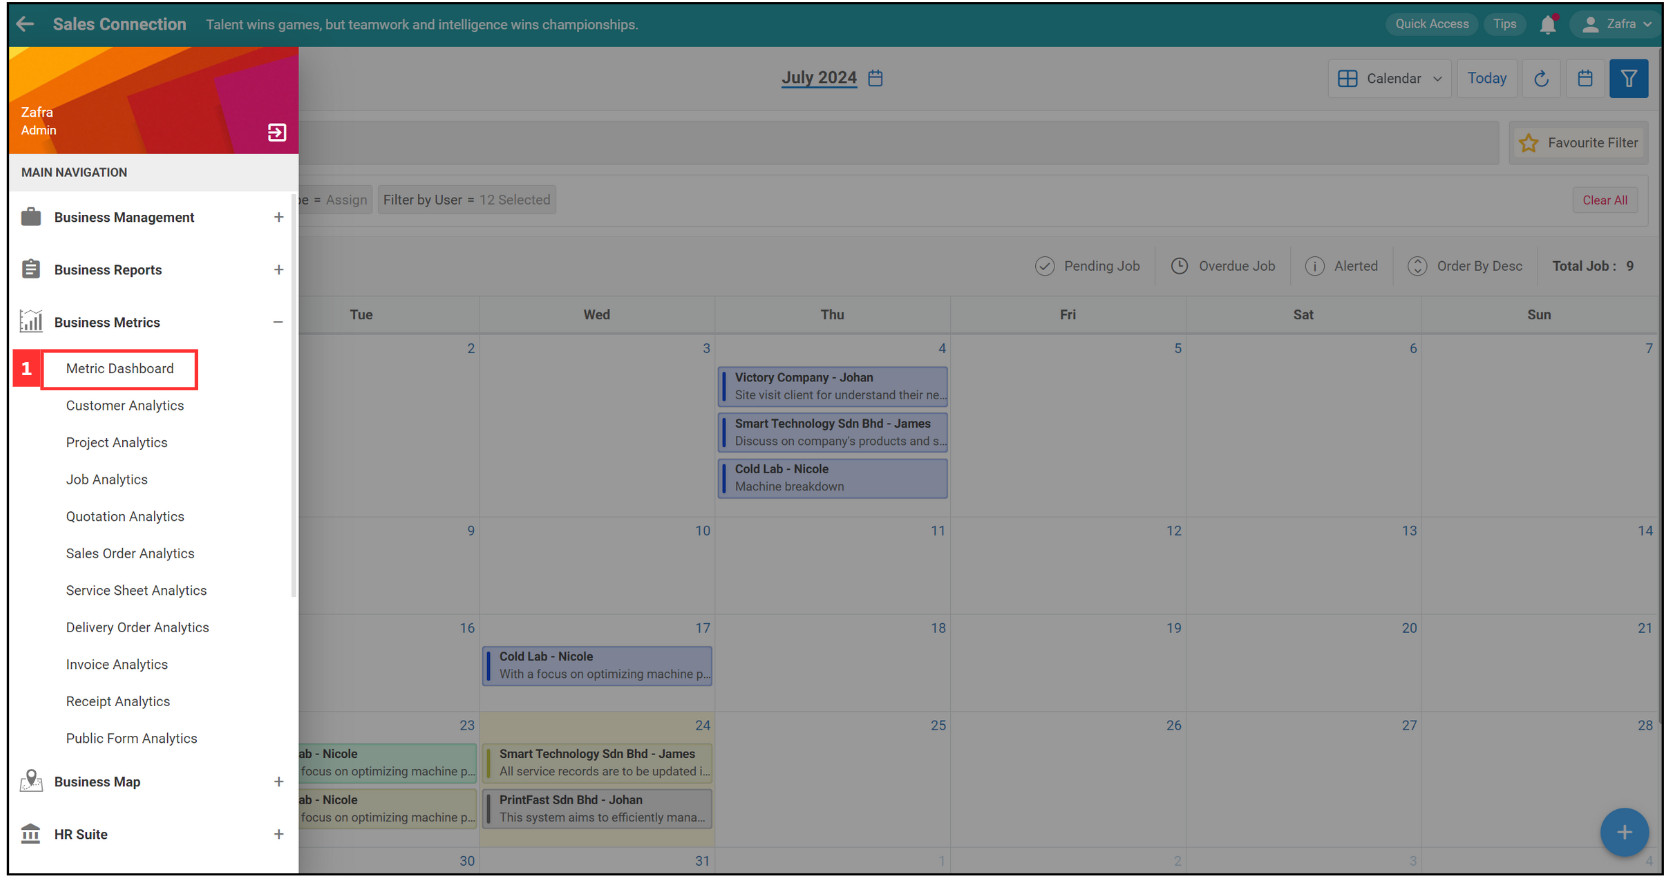
Filter by Date Range
-
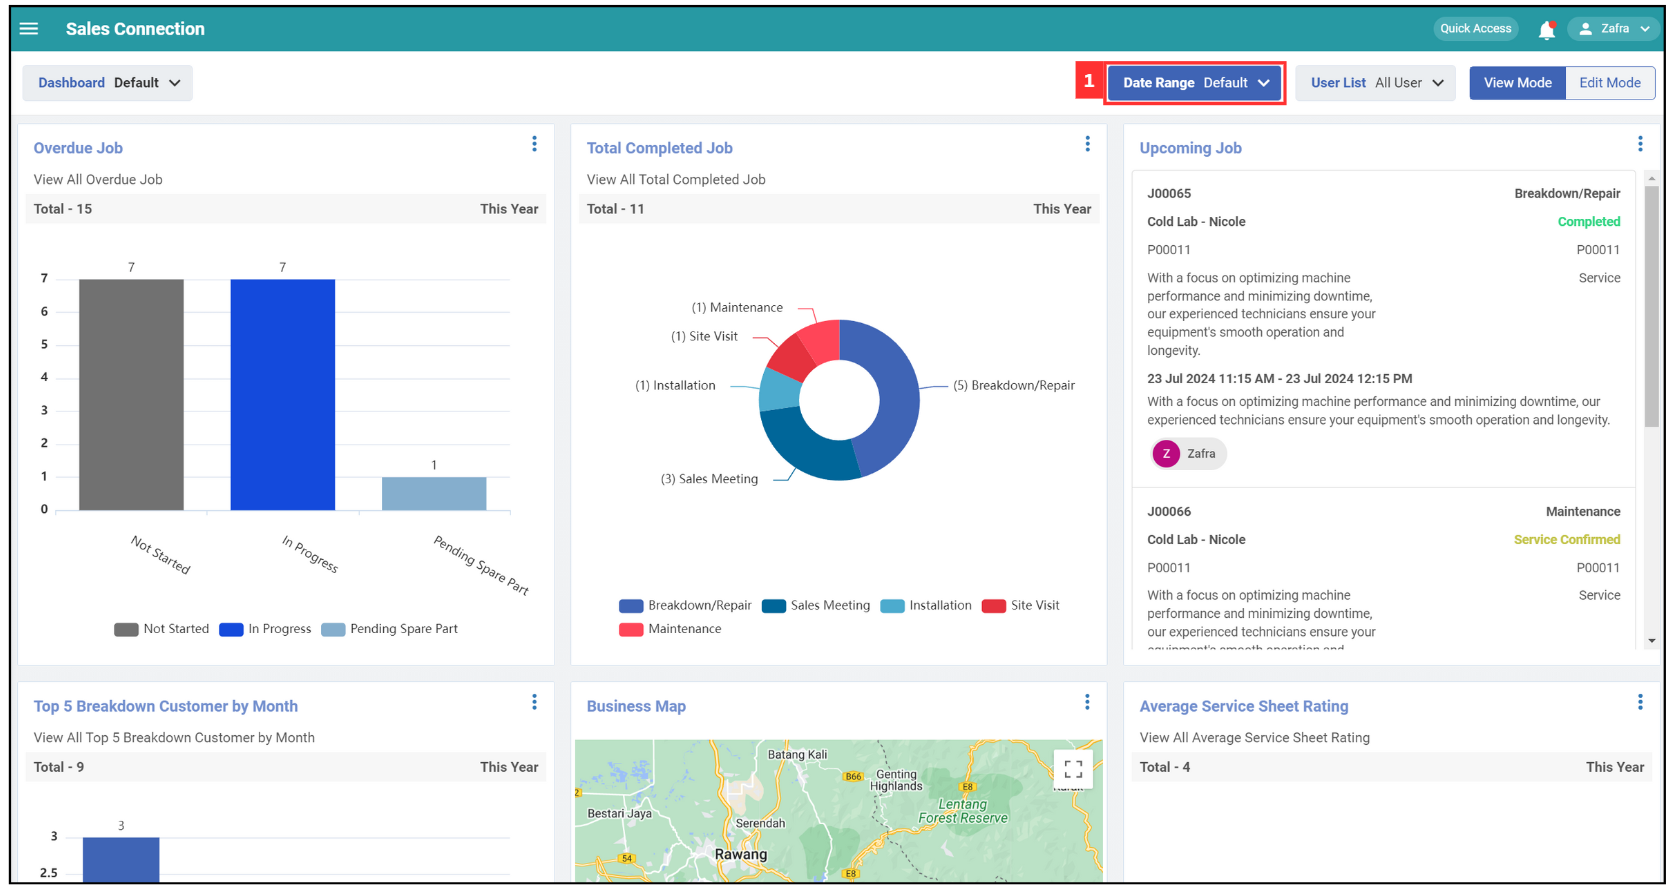
Click on the “Date Range”.
-
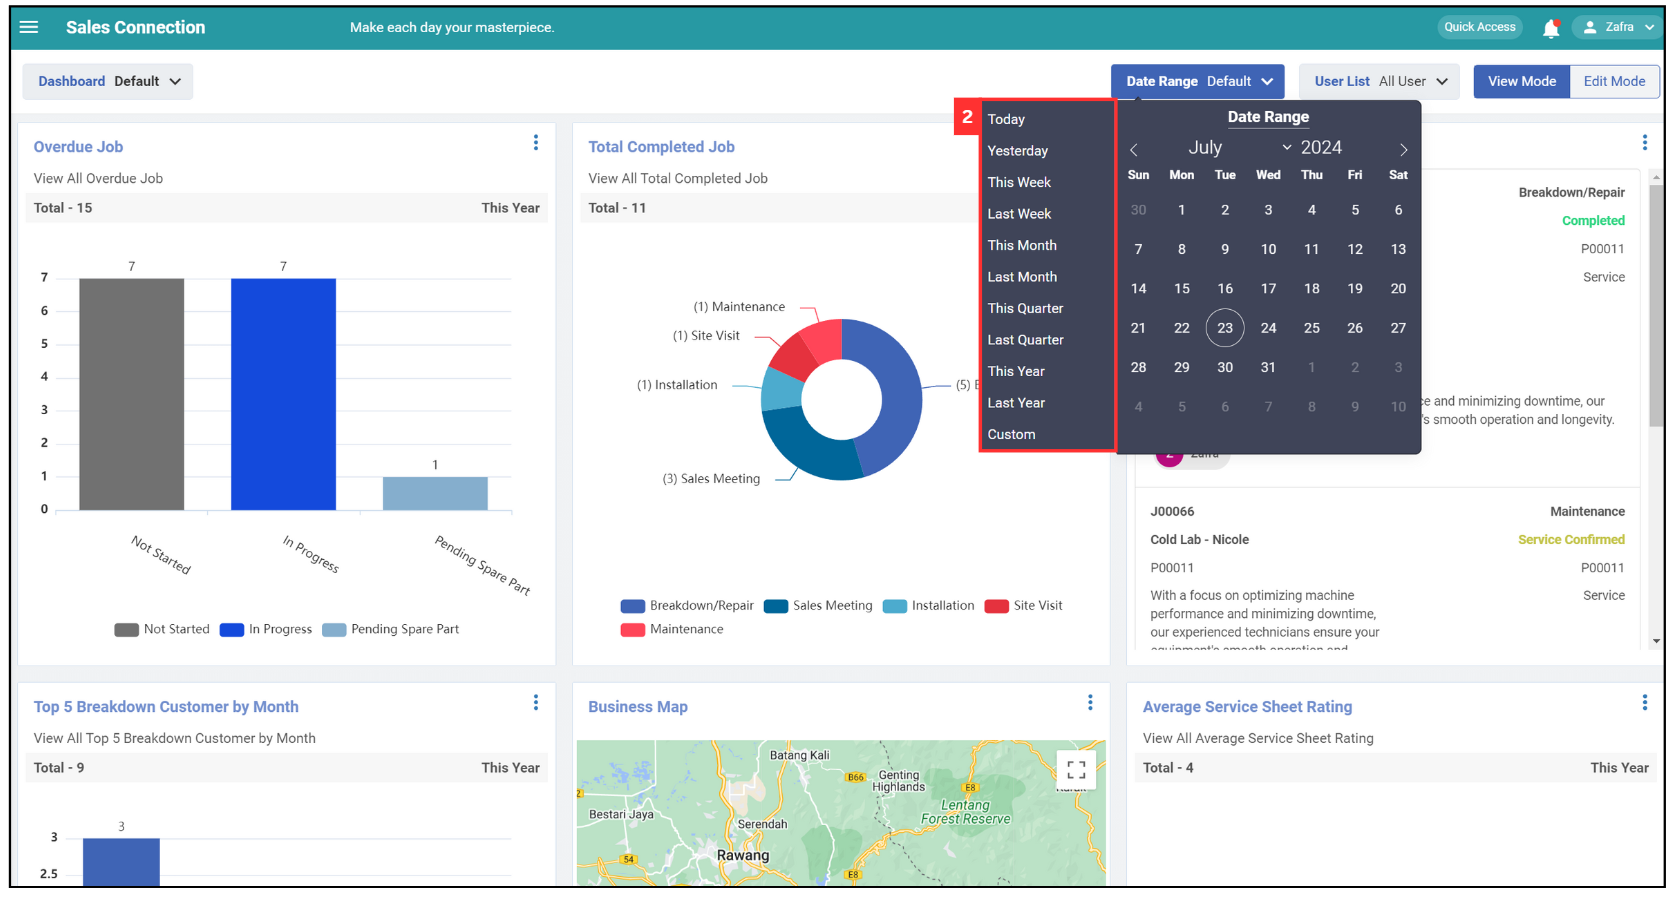
Select the date range of the data you want to view.
-
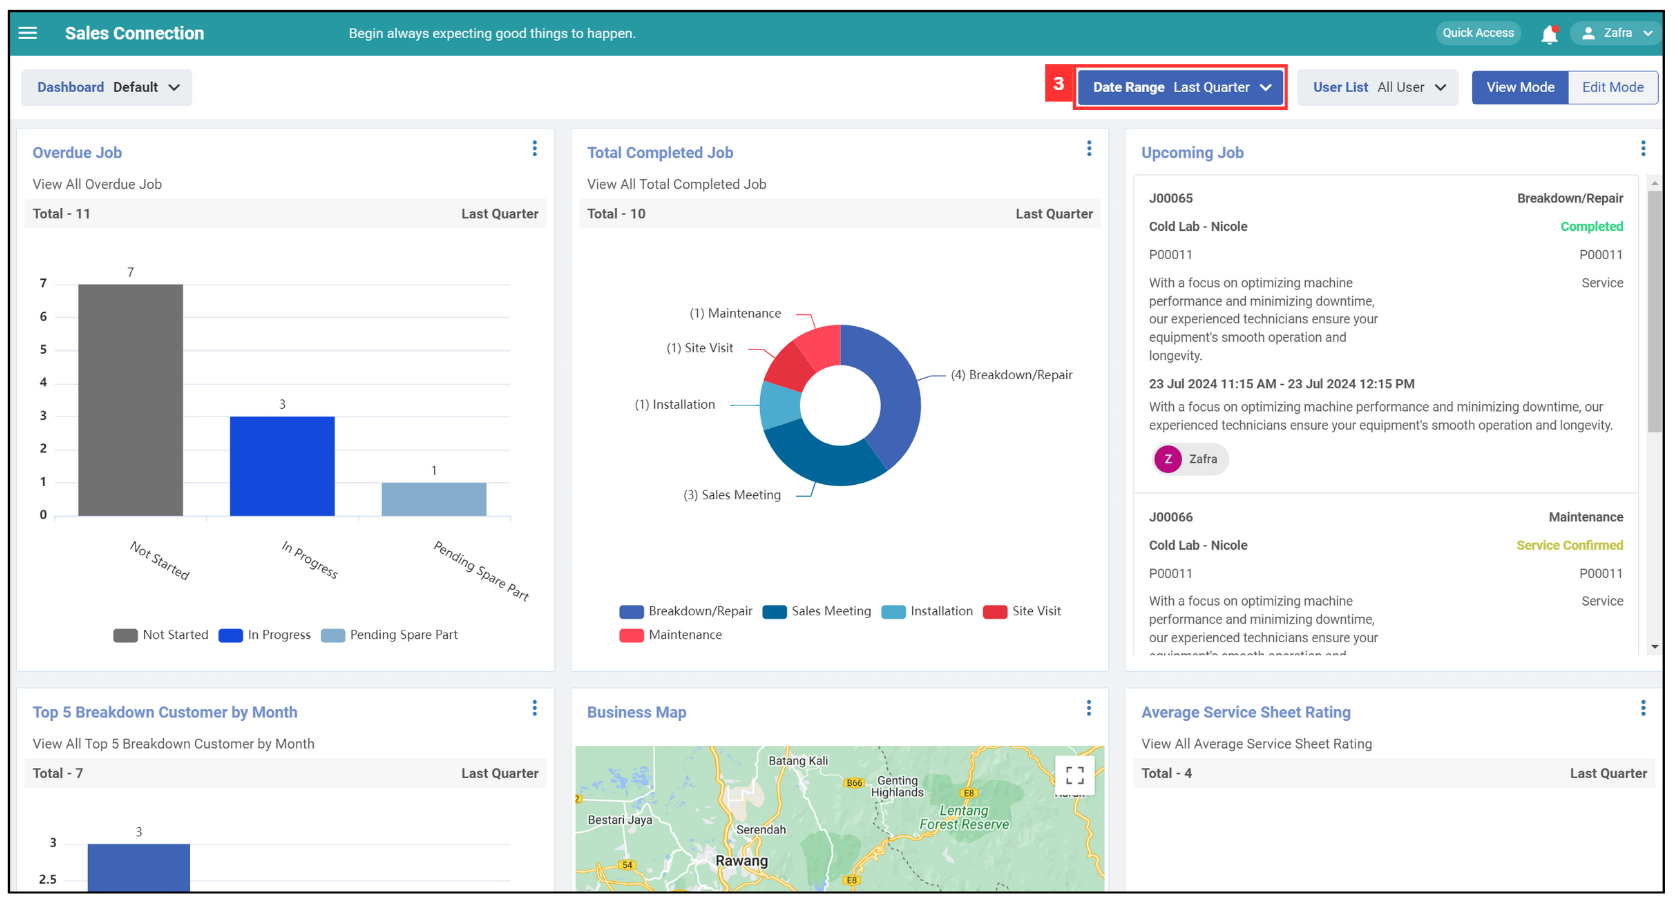
The date range has been applied successfully.
Filter by User List
-
Click on the “User List”.
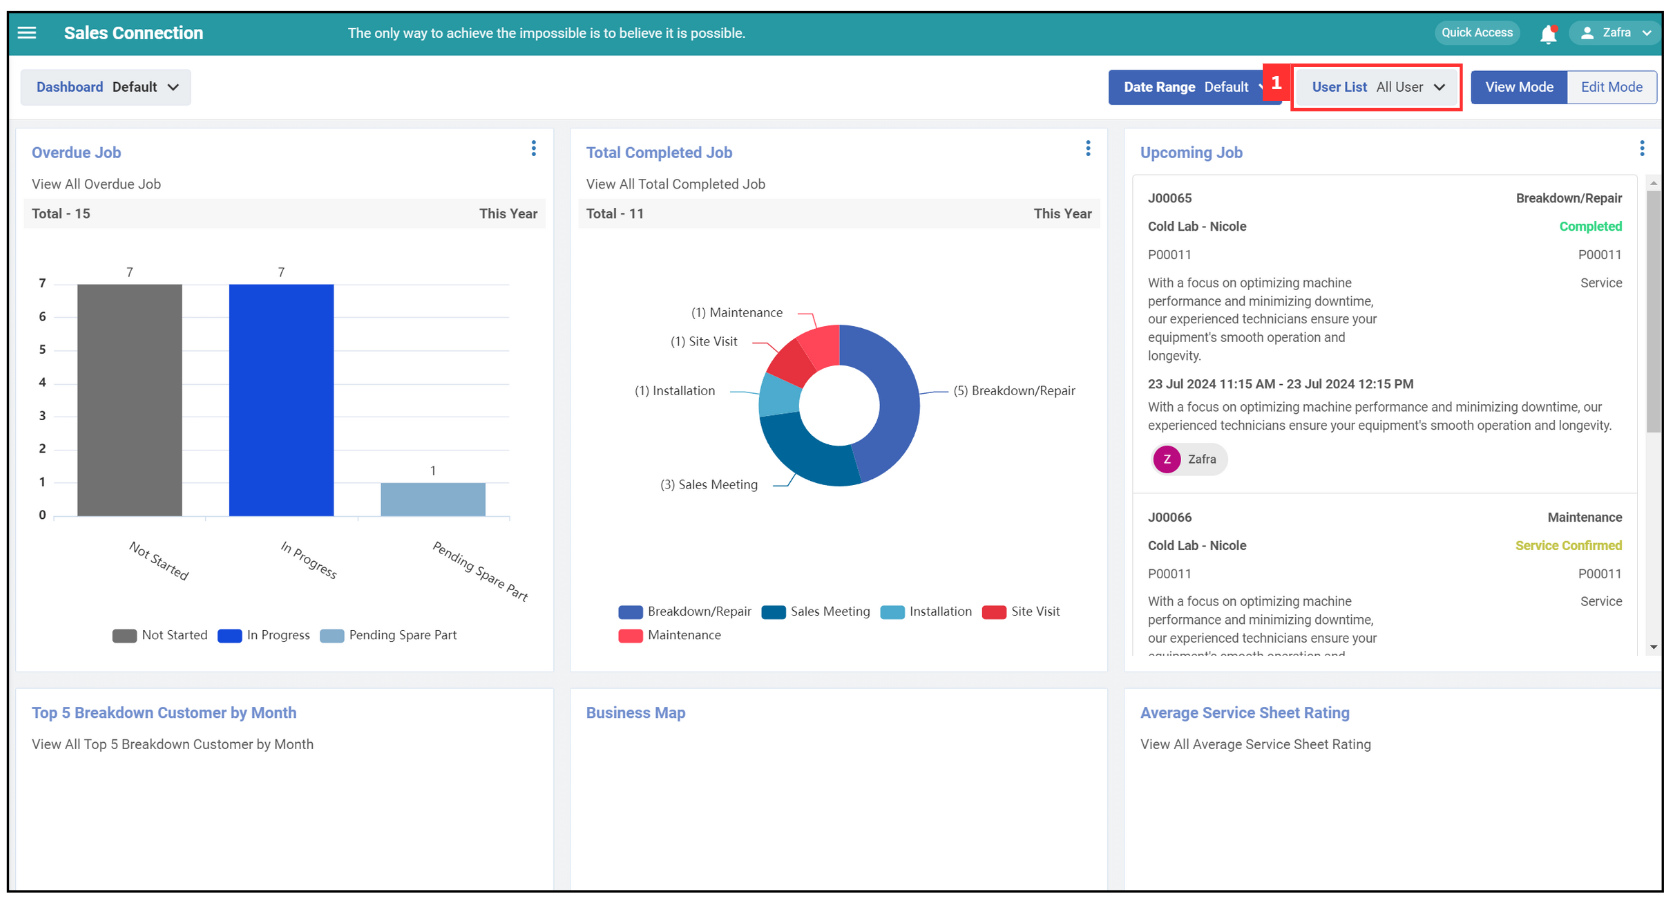
-
Select the user/department’s data you want to view.
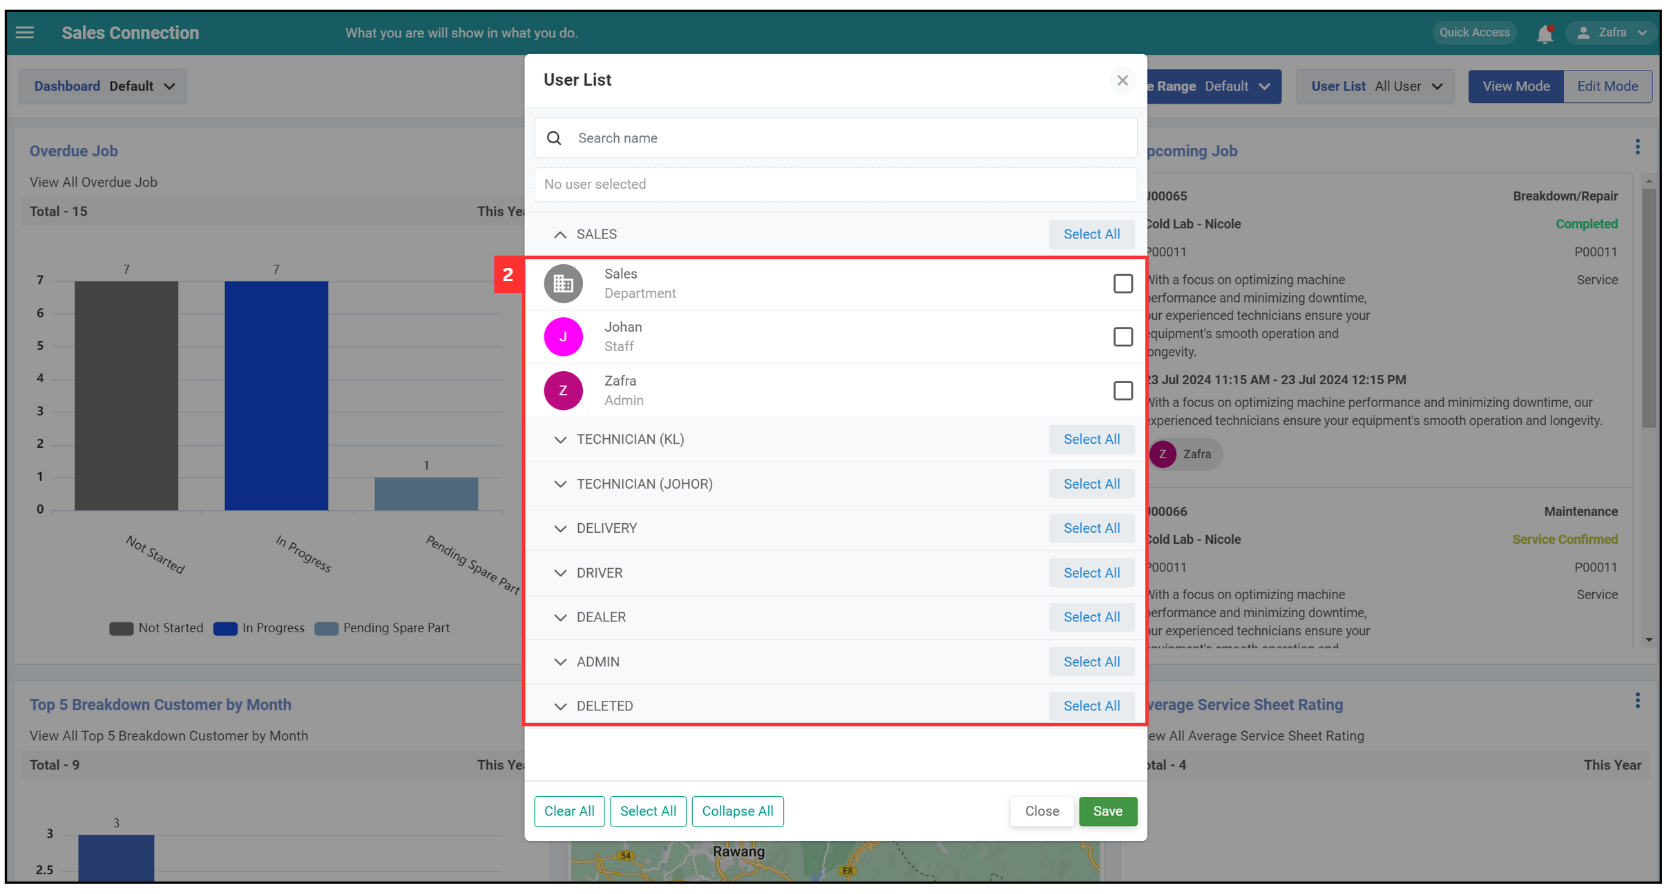
-
Click “Save”.
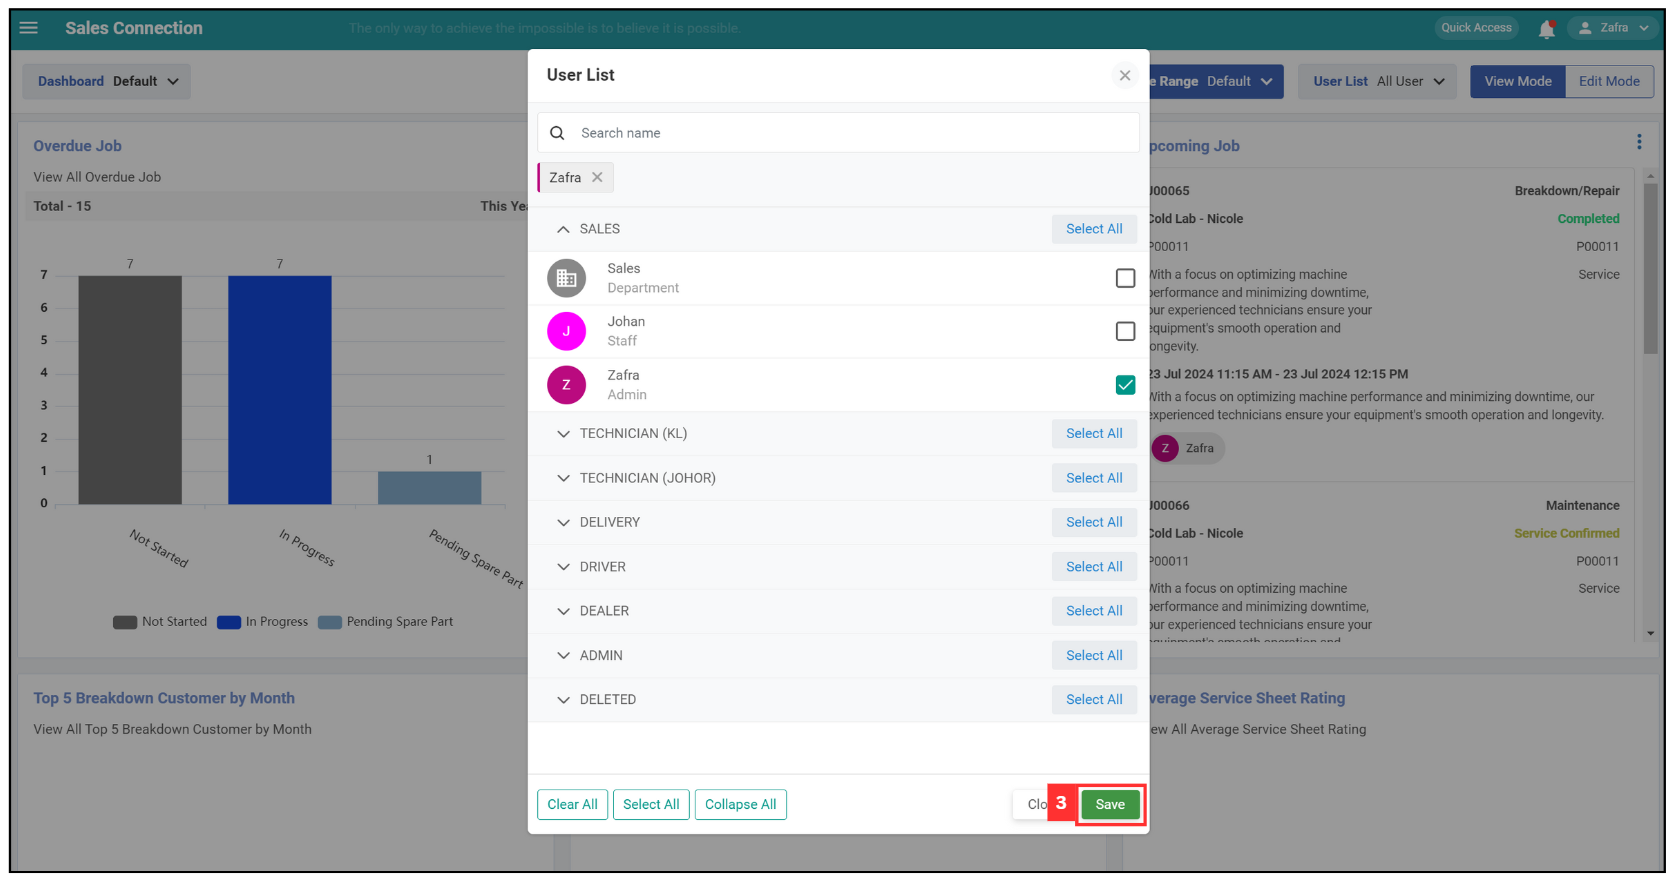
-
The dashboard filter applied by the selected user has been applied successfully.
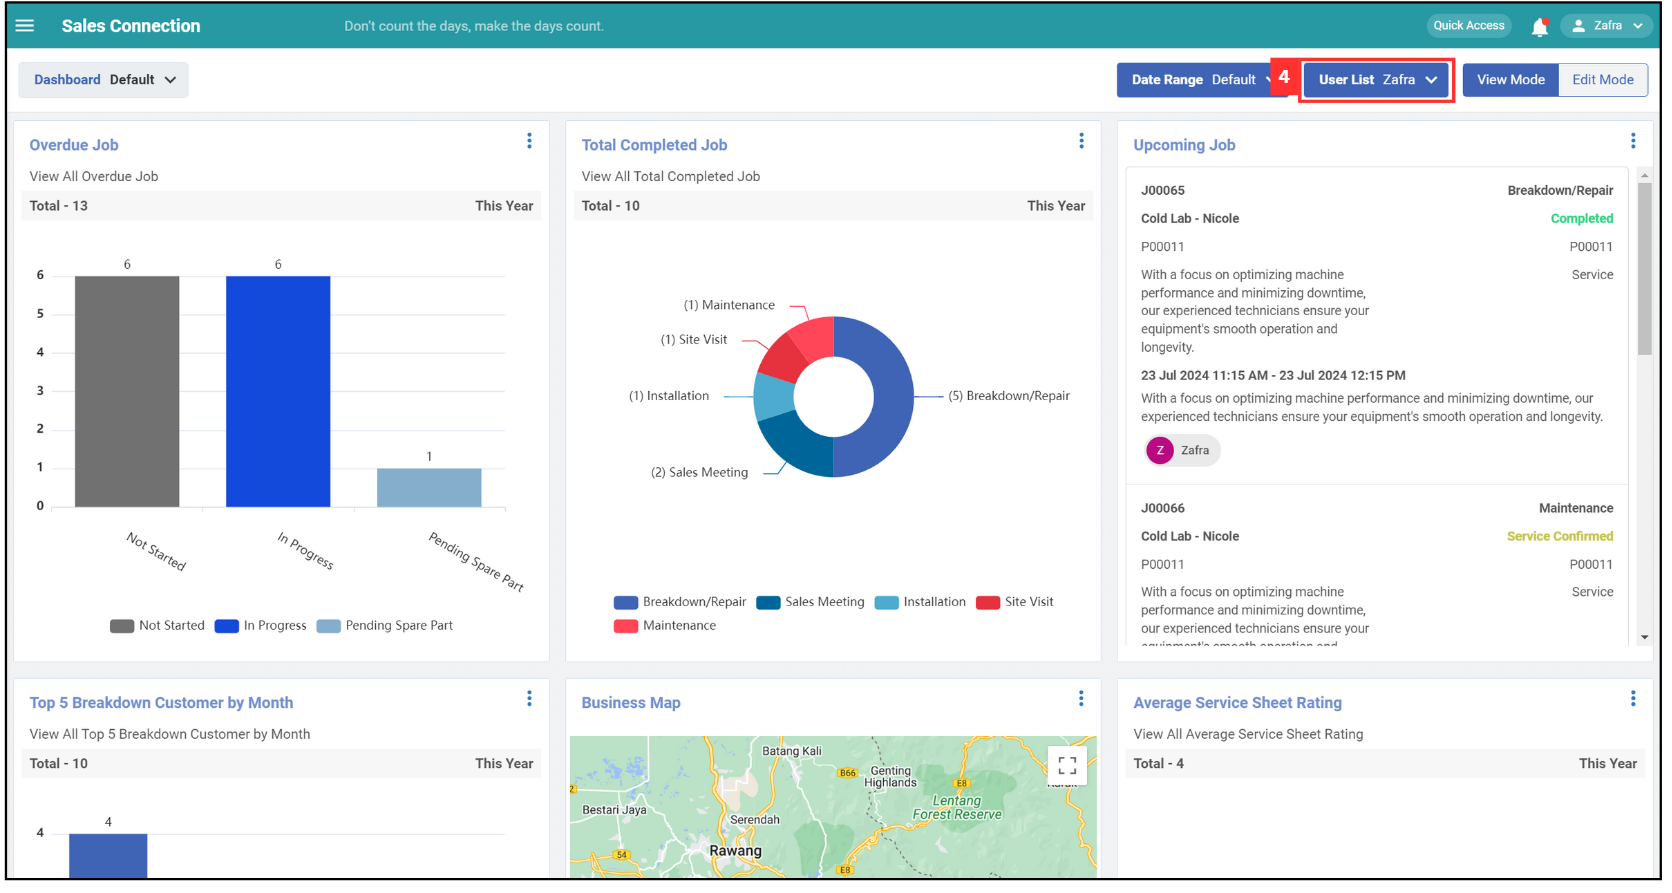
View Mode
-
View Mode will be the default mode when you enter this page.
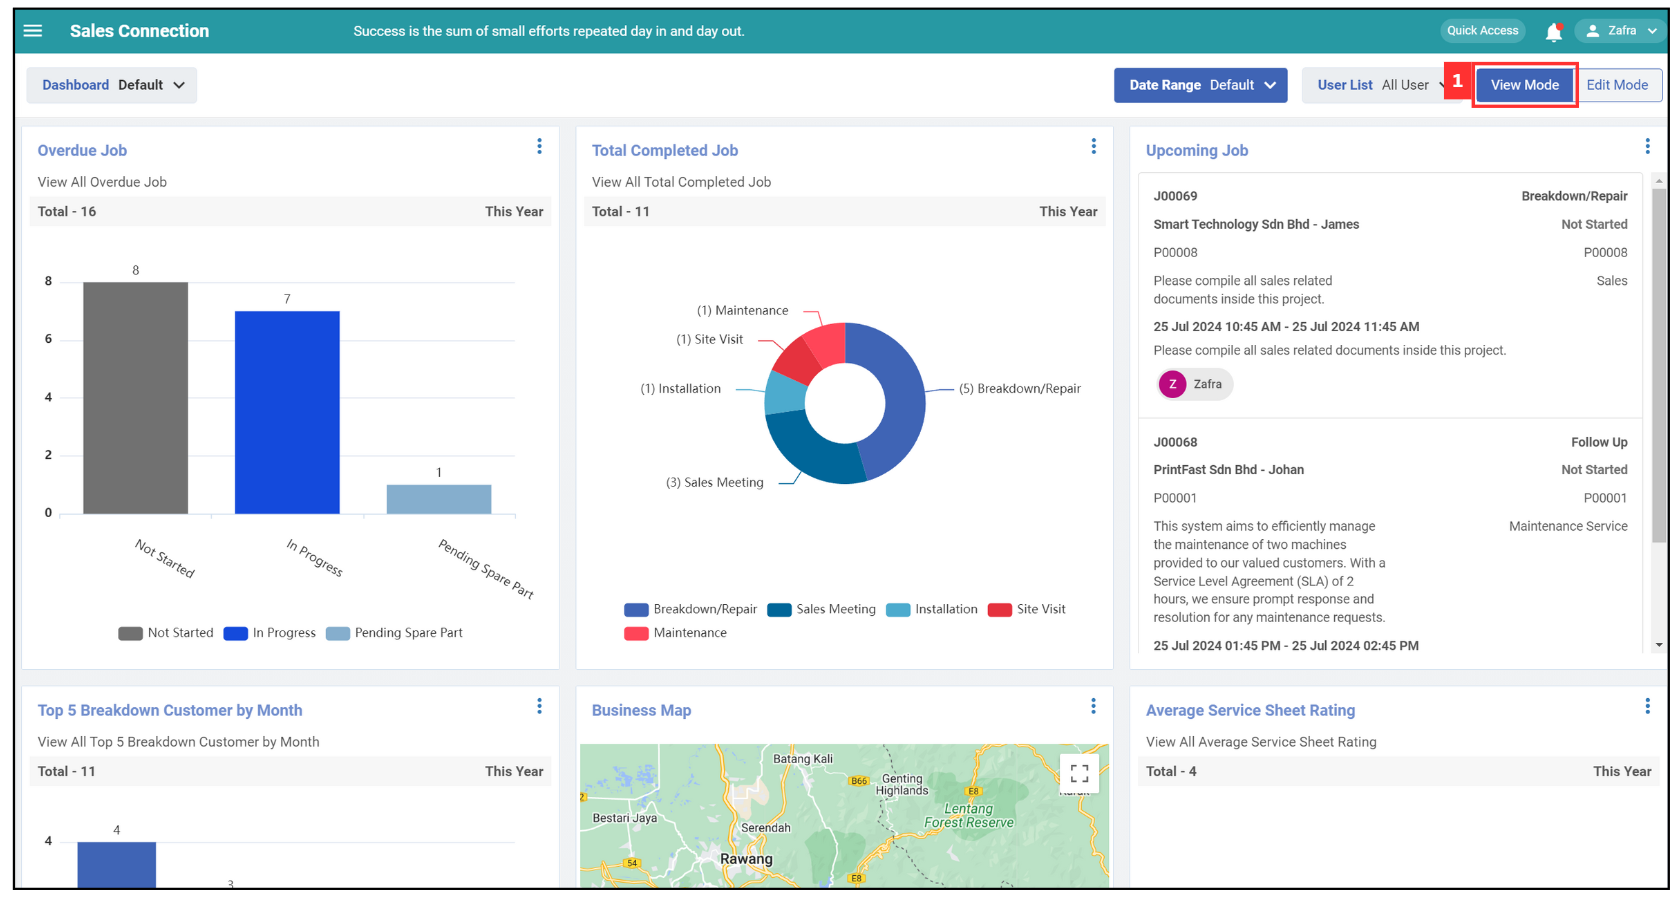
-
Click on the three dots icon.

-
You can either choose one of them.
Terms Description View More View the full details of the selected chart. Download Chart Download the selected chart in your device. 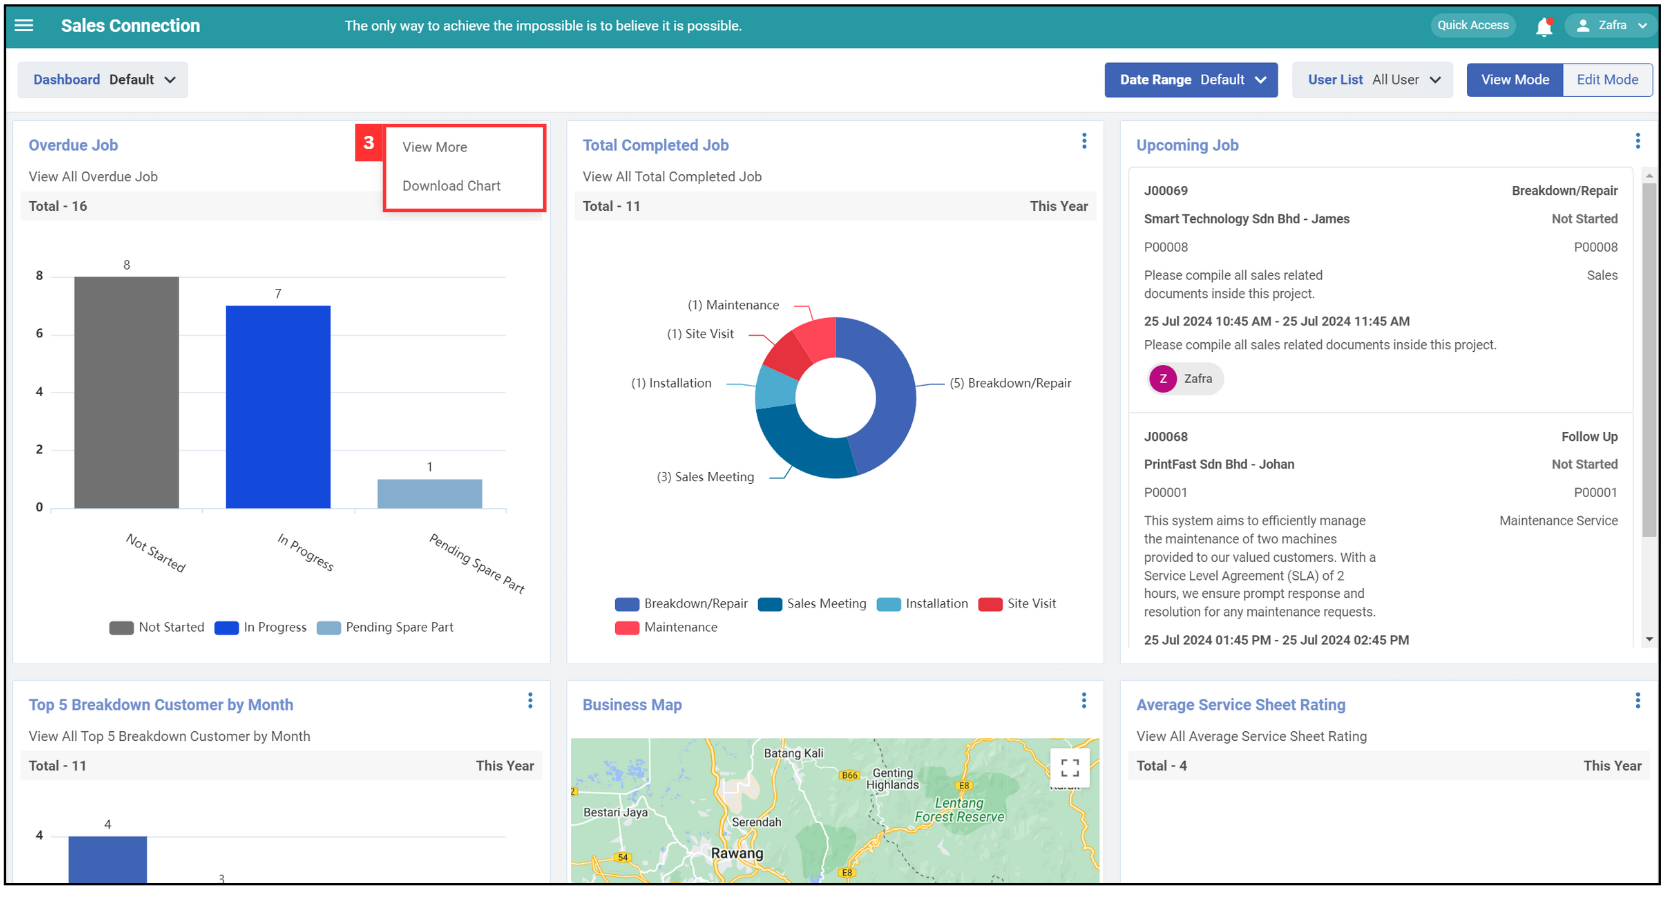
Edit Mode
*Note: Edit Mode in this page is only use for expand the graph and change position.
Resize Chart
-
Click “Edit Mode”.
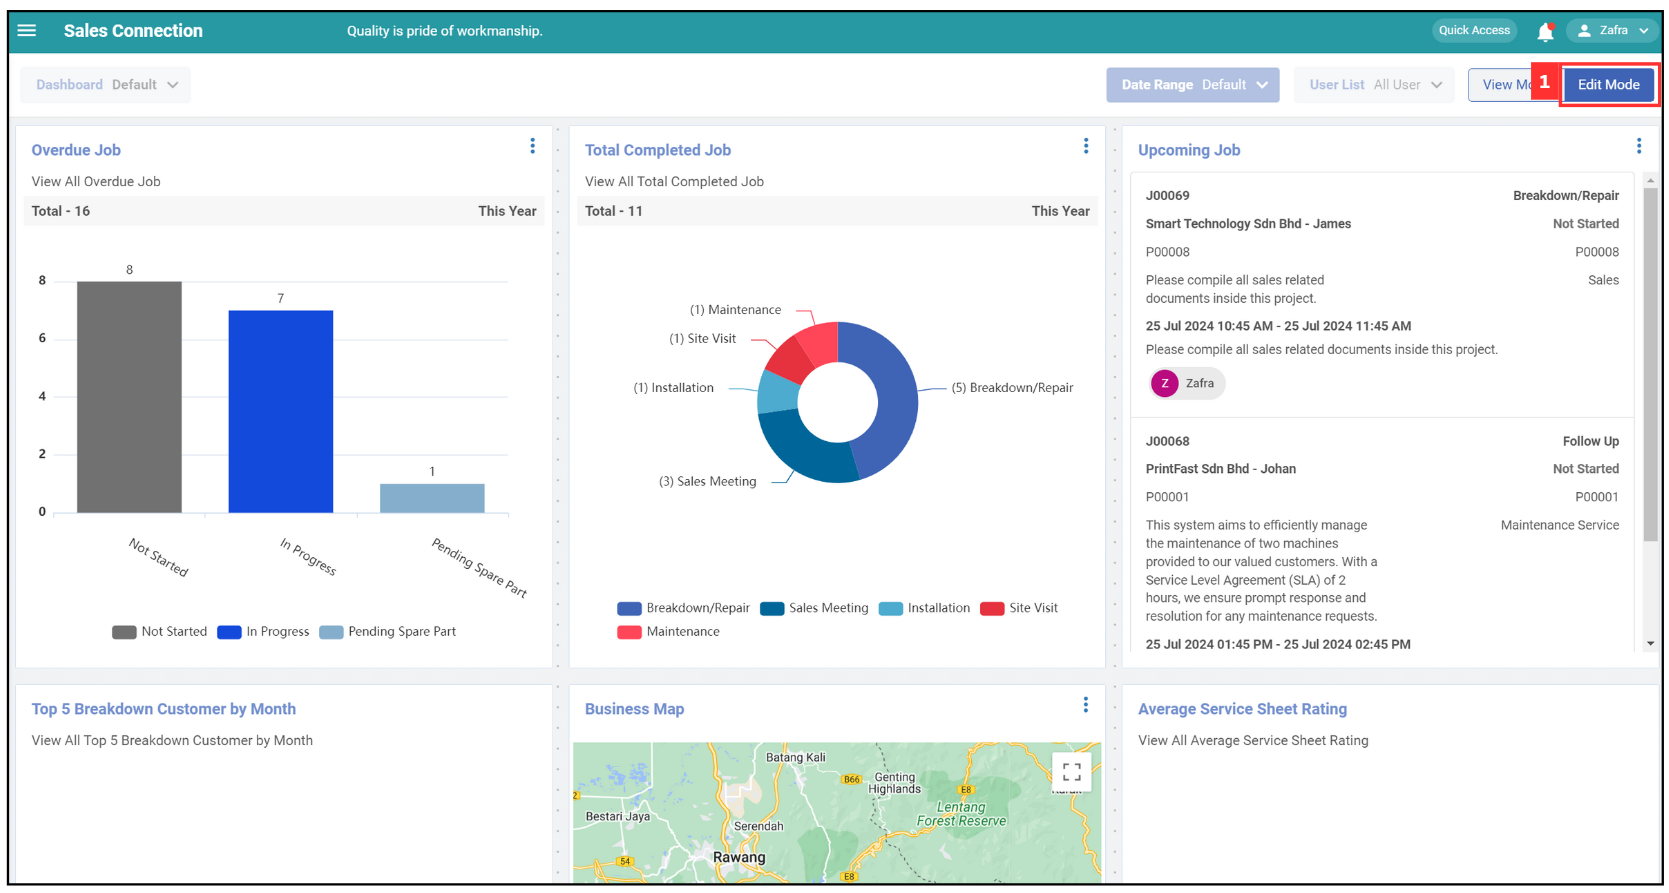
-
Click on the three dots icon to adjust the graph size.
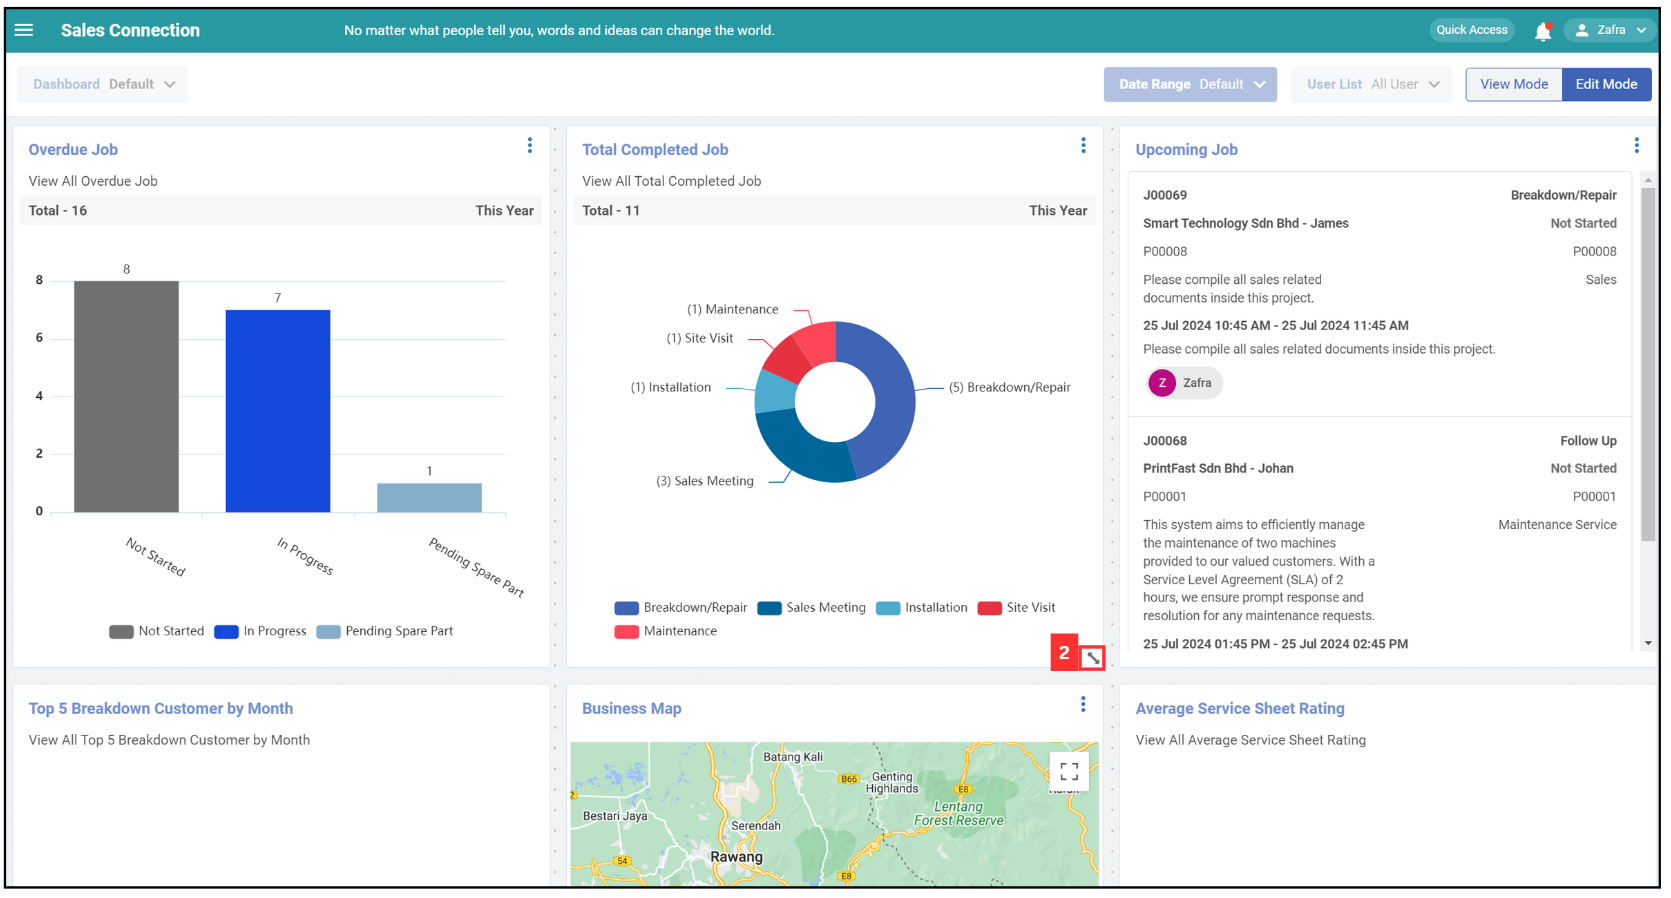
-
The adjustment has been made and will be automatically saved.
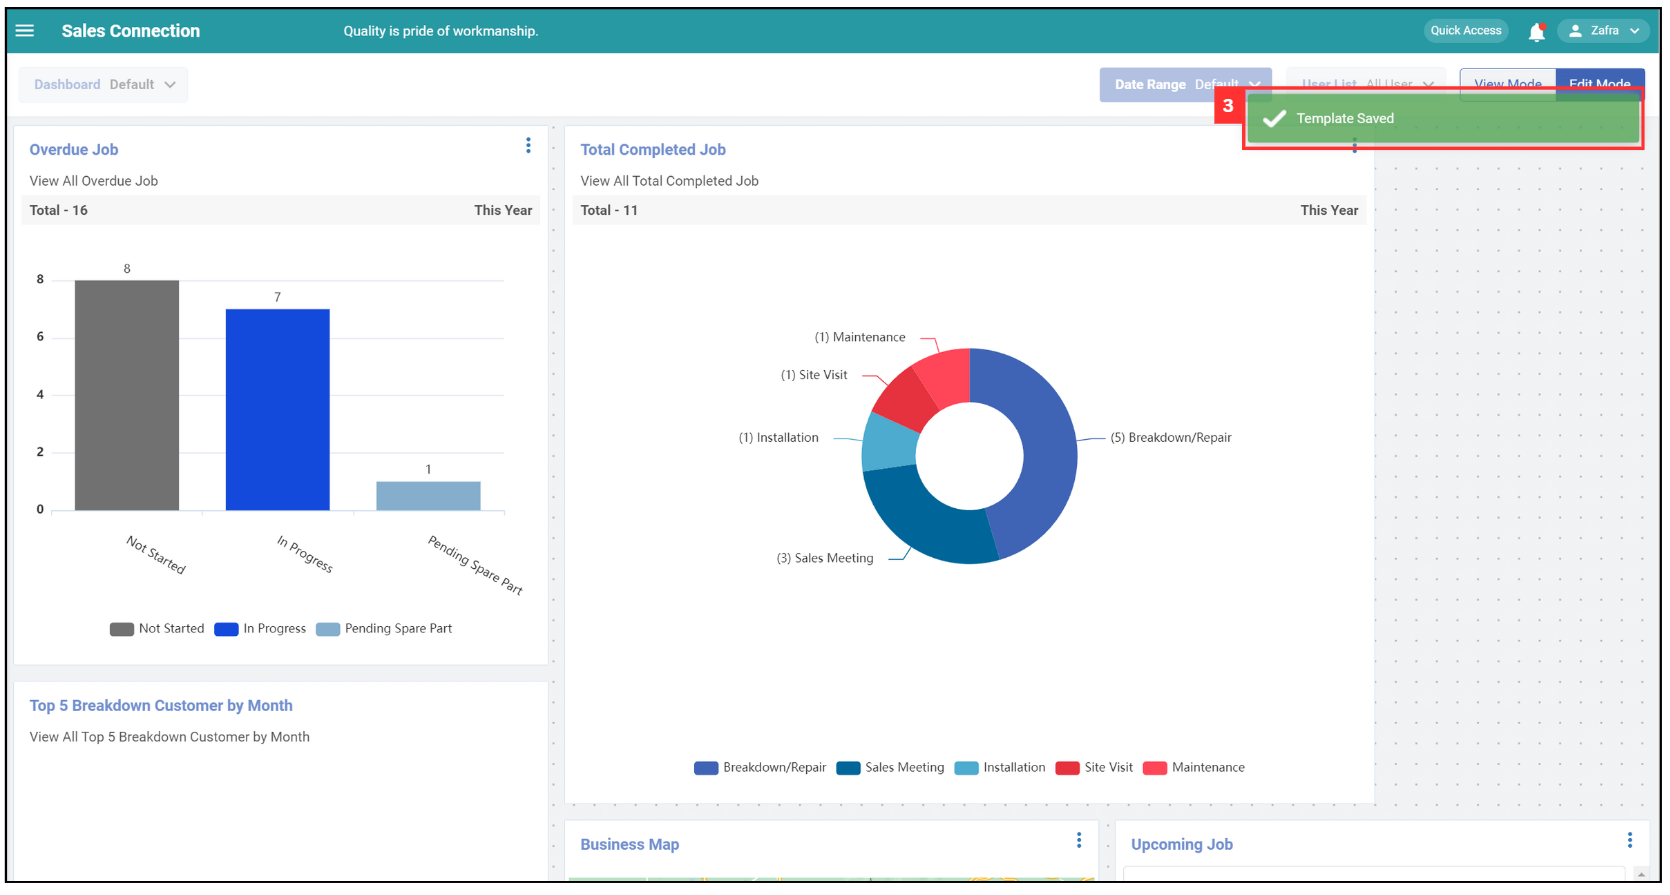
Reposition Chart
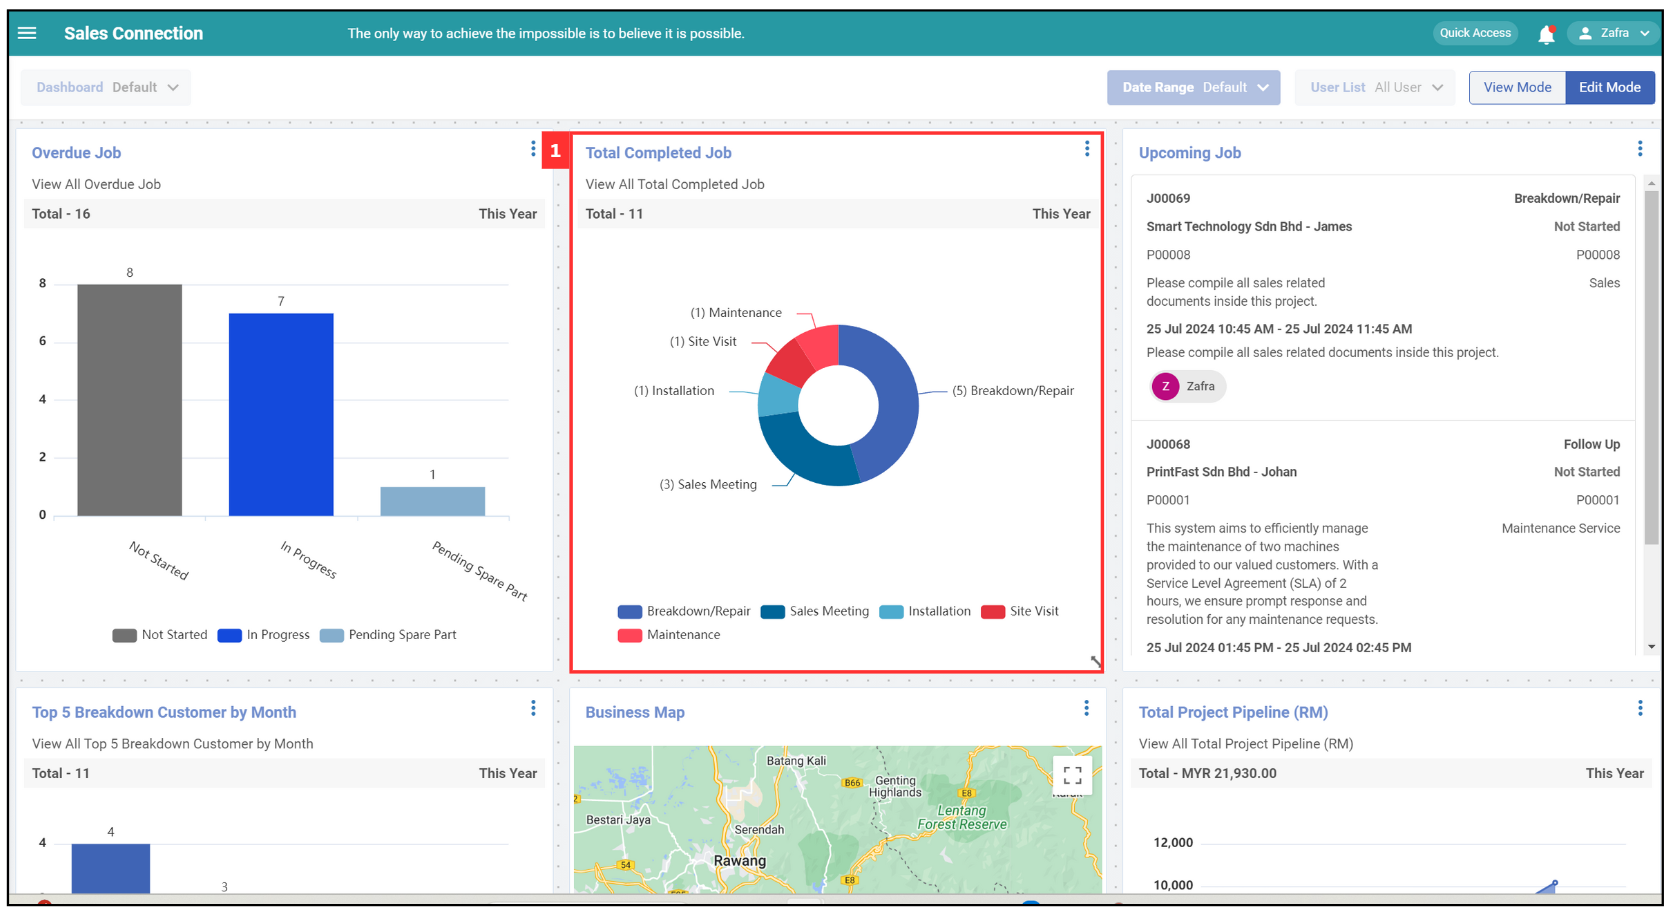
-
Long click the chart you want to reposition.
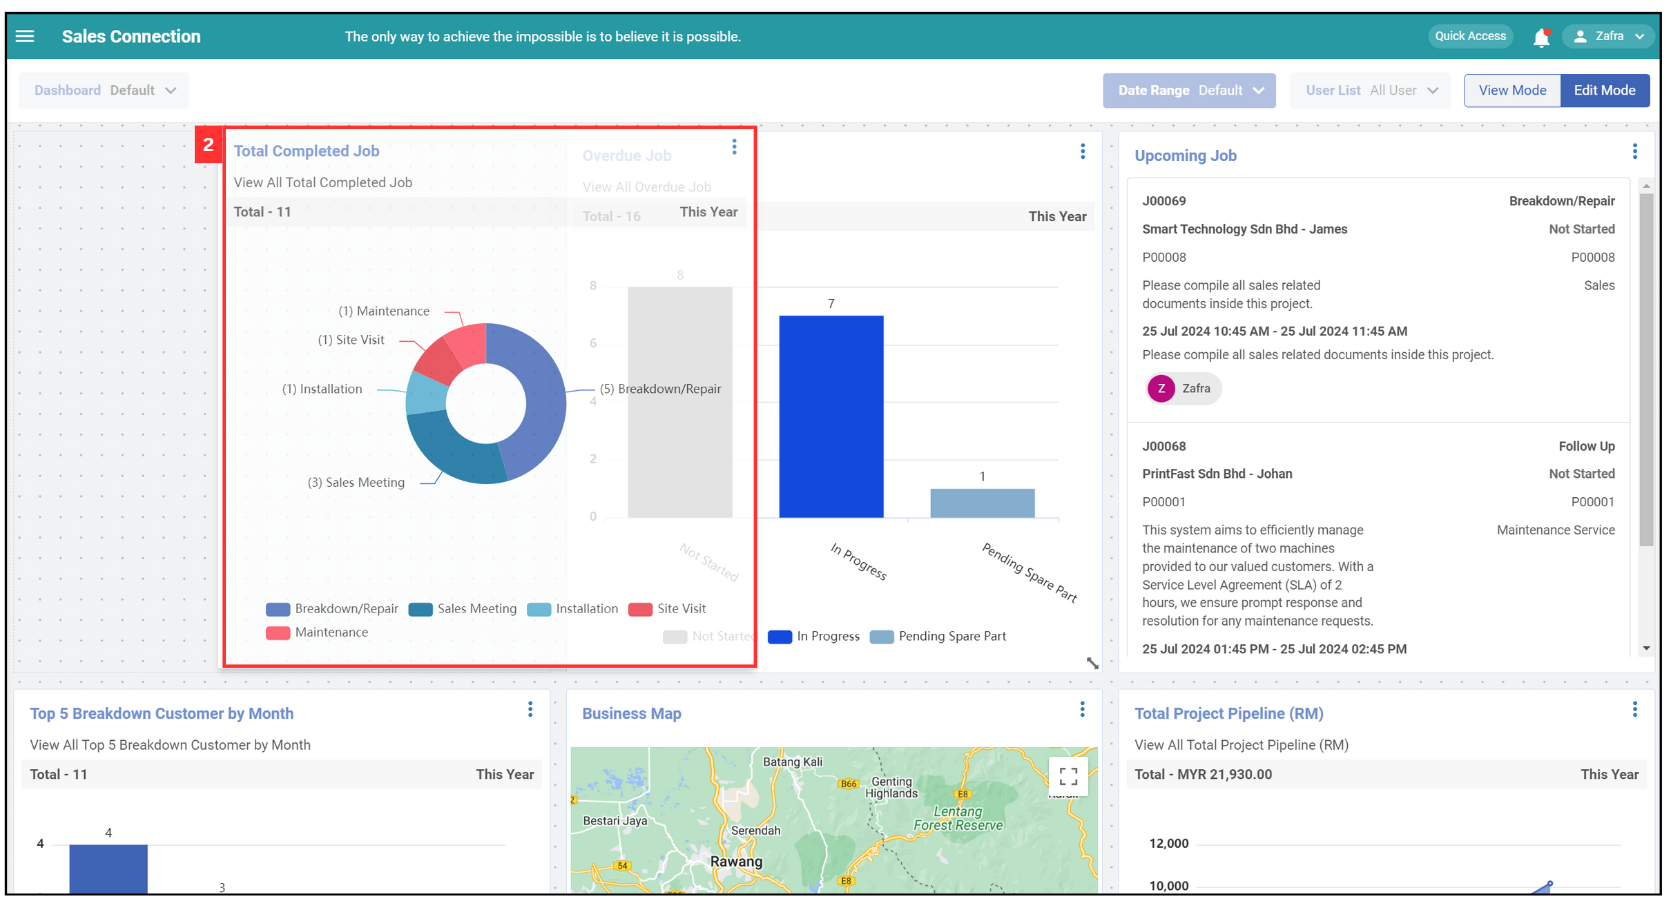
-
Drag the chart to the desired location.
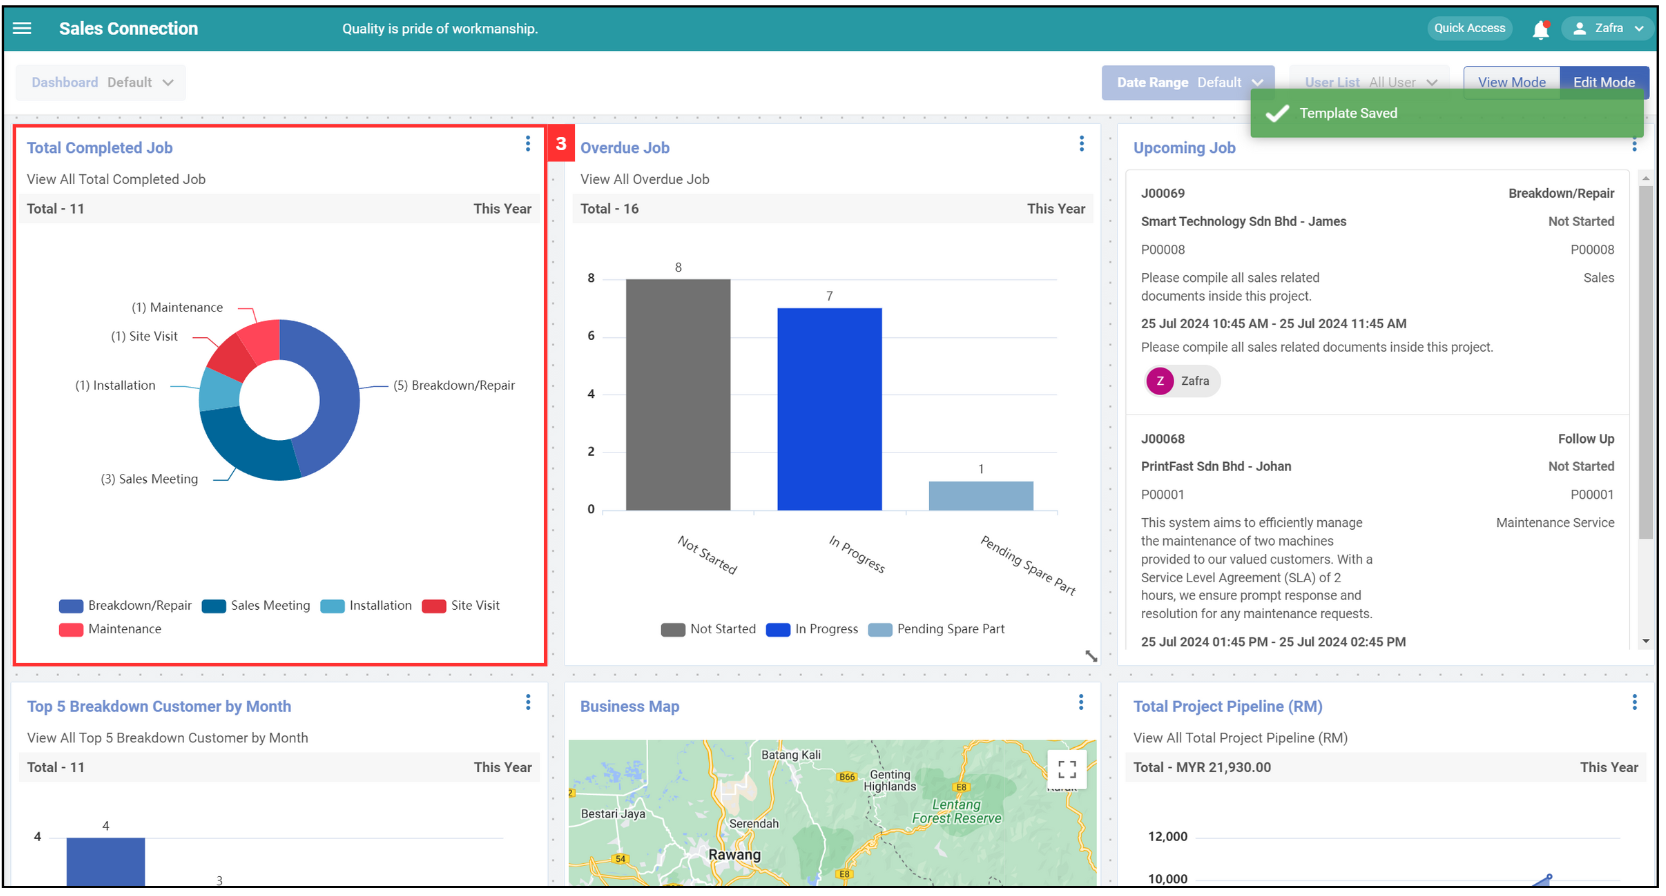
-
The adjustment has been made and will be automatically saved.
Select Group
-
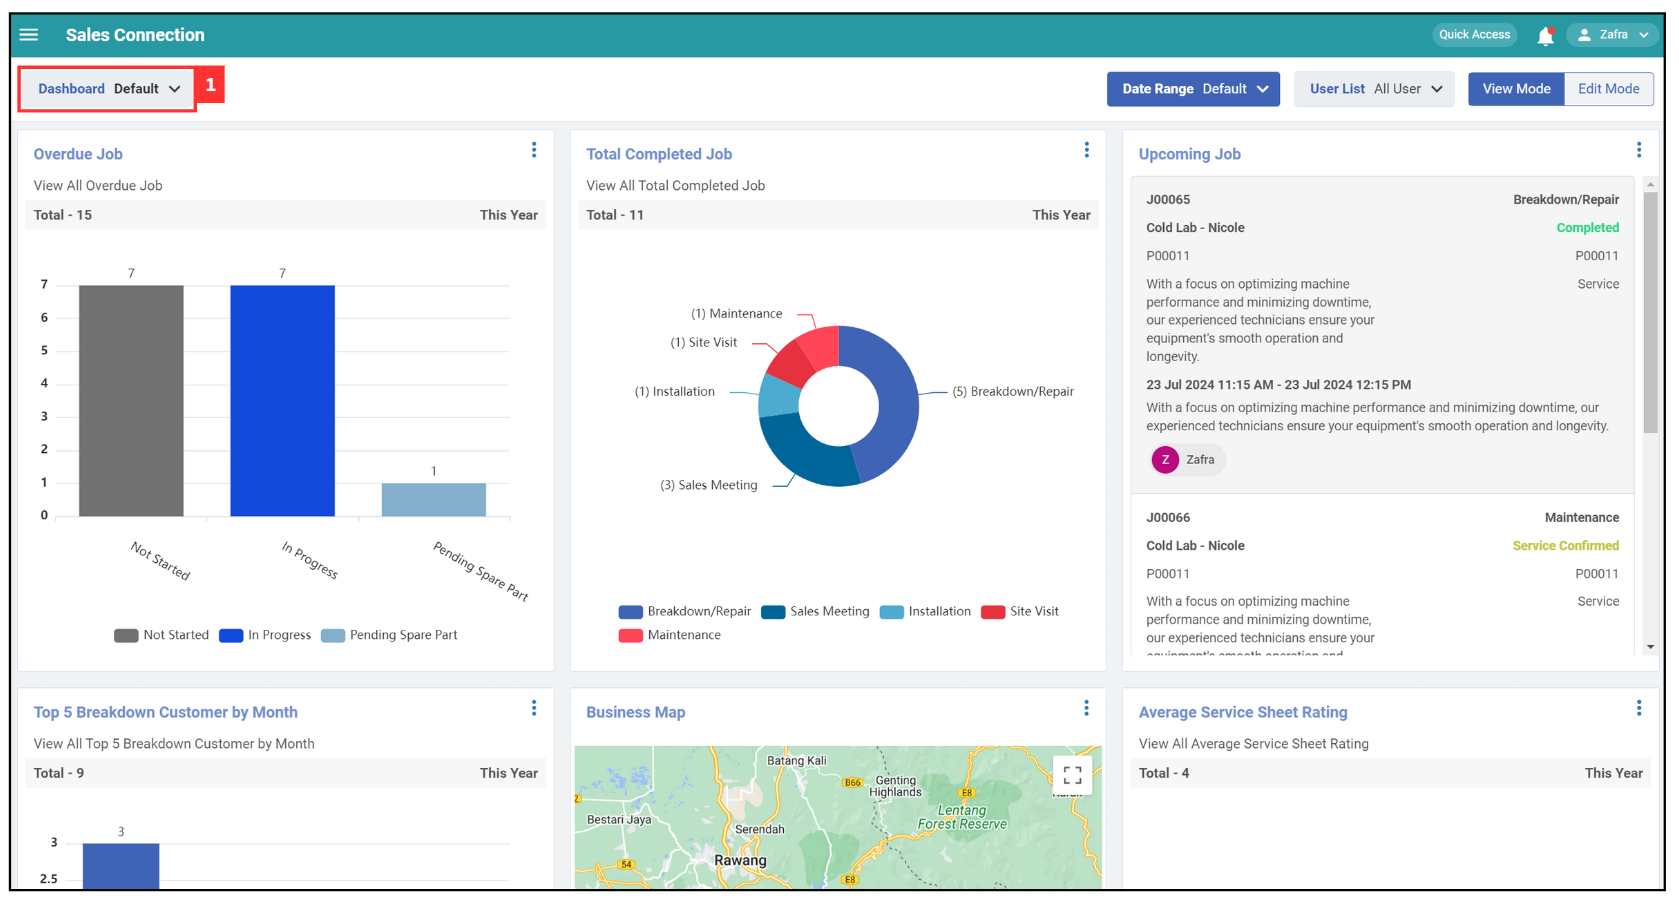
Click on “Dashboard” at the top left corner of the page.
-
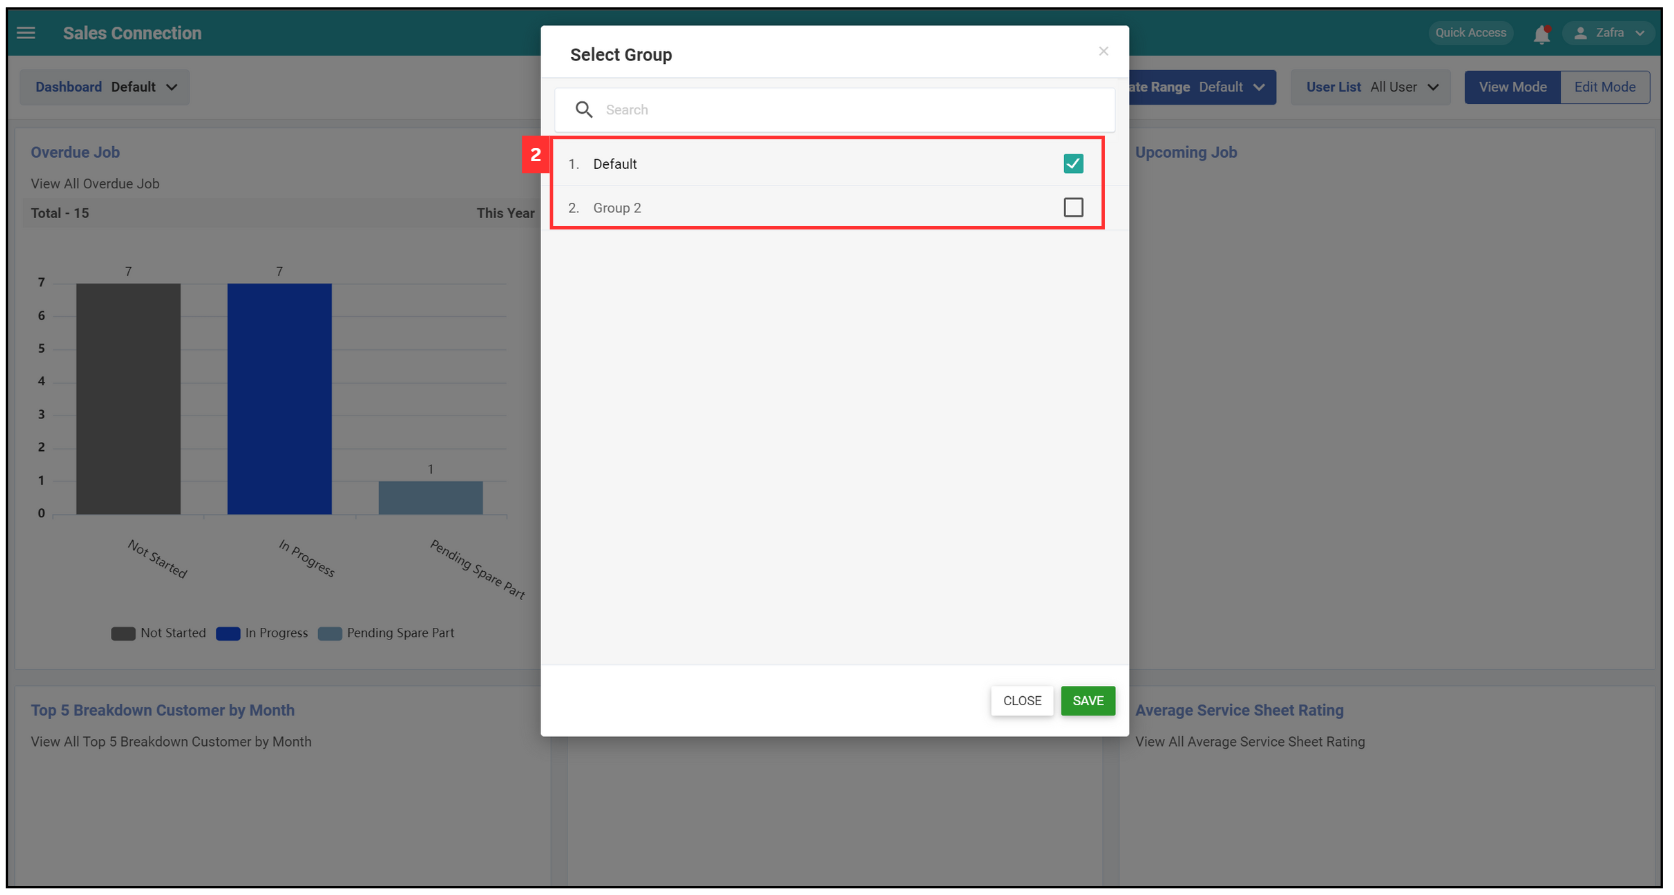
Tick the box to select a group for your dashboard.
-
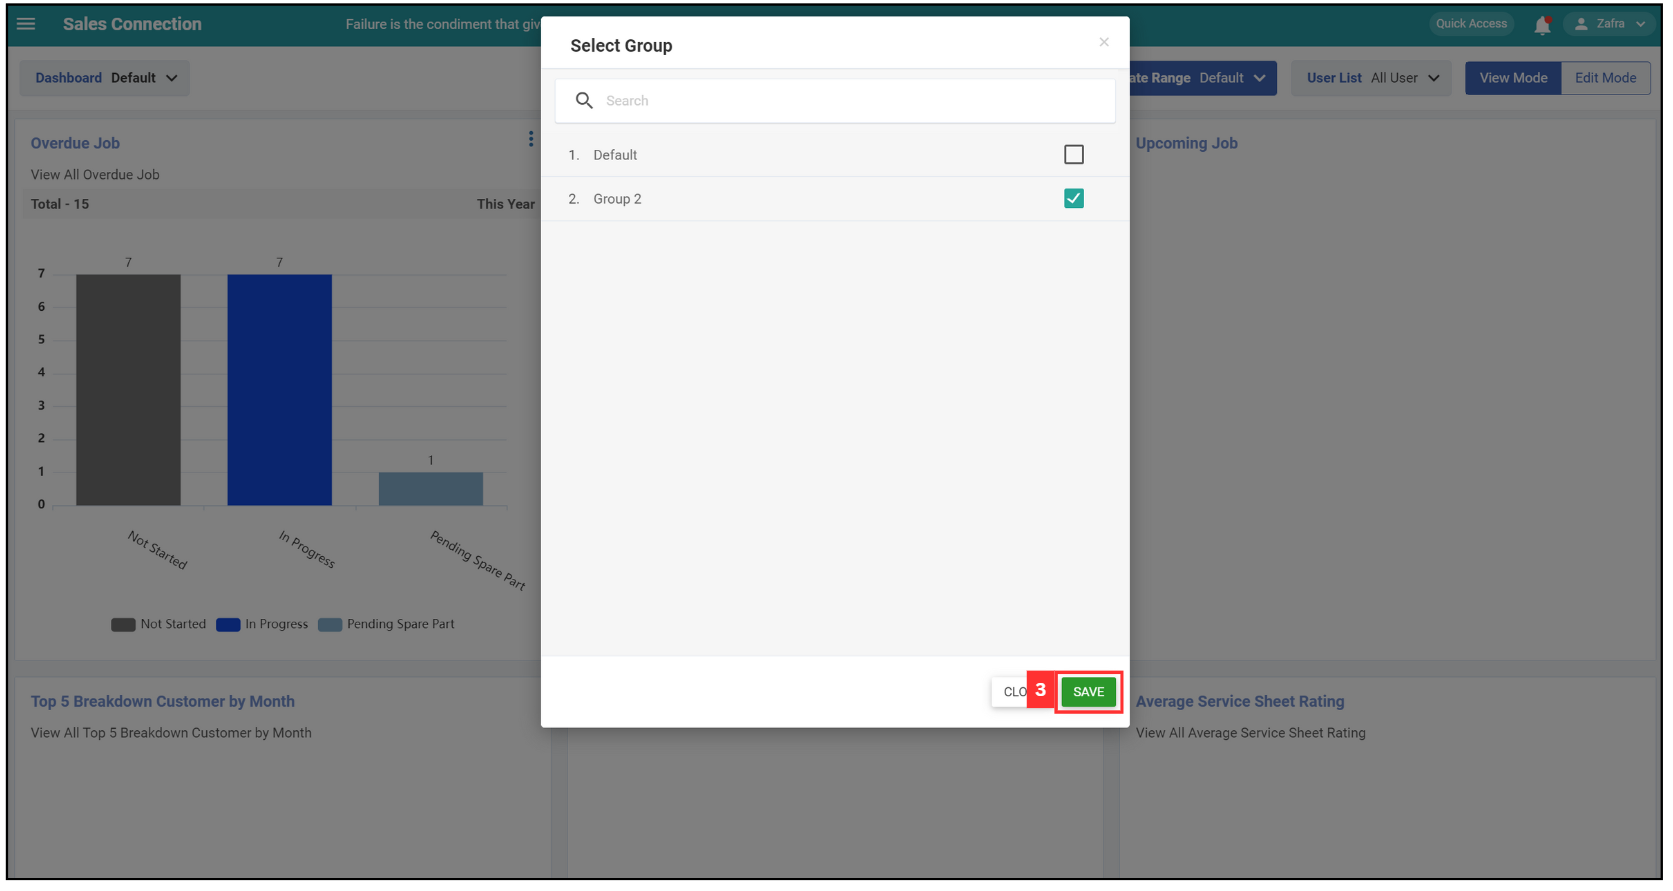
Click “Save”.
-
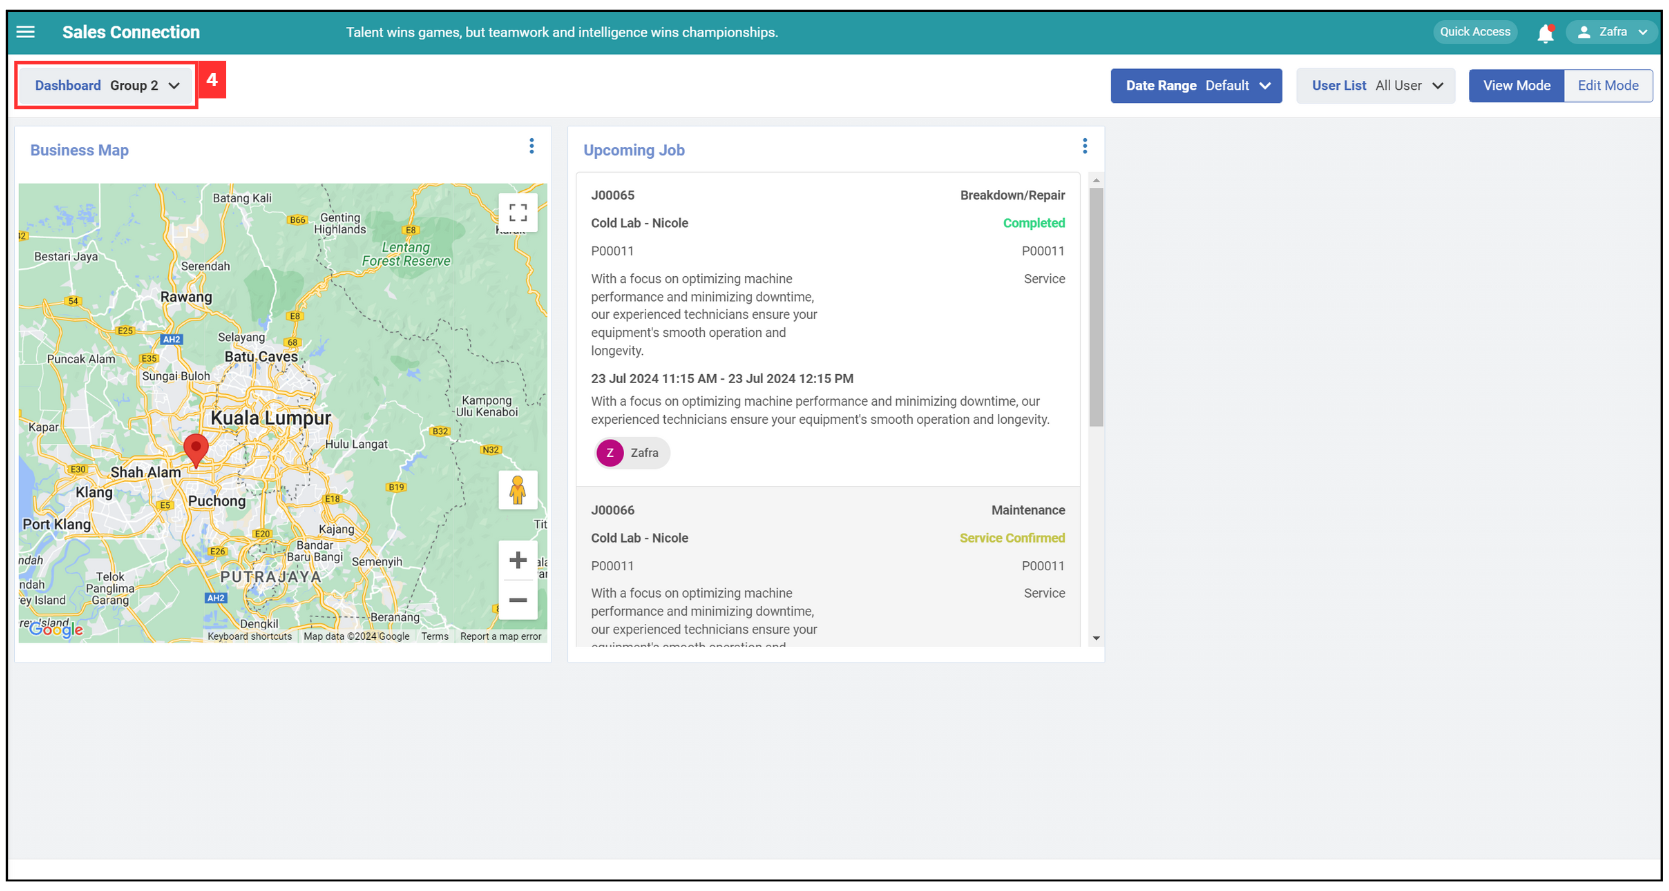
The dashboard has been applied successfully.
Related Articles